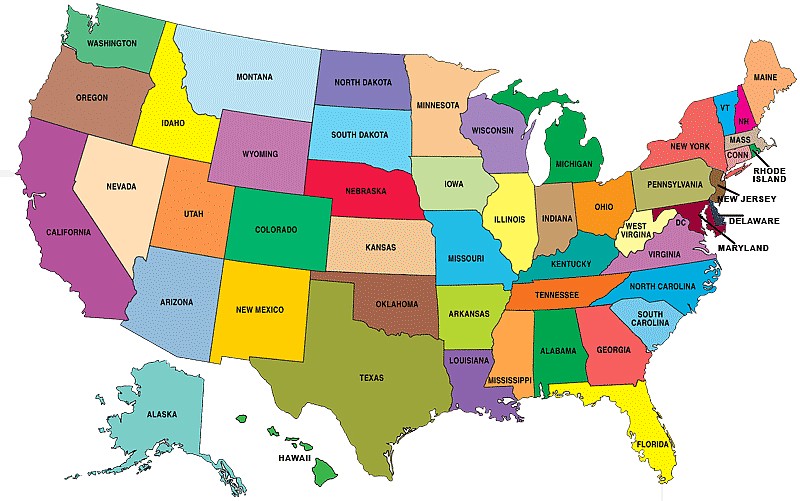
The share of workers who were members of a labor union last year across the United States fell to 10.7 percent - the lowest level on record. But union membership grew in Tennessee from 146,000 in 2015 to 158,000 last year.
1. South Carolina, 1.6 percent, down from 2.1 percent
2. North Carolina, 3 percent, unchanged
3. Georgia, 3.9 percent, down from 4 percent
4. Arkansas, 3.9 percent, down from 5.1 percent
5. Texas, 4 percent, down from 4.5 percent
6. Louisiana, 4.2 percent, down from 5.8 percent
7. Virginia, 4.3 percent, down from 5.4 percent
8. Arizona, 4.5 percent, down from 5.2 percent
9. Utah, 4.7 percent, up from 3.9 percent
10. South Dakota, 5.2 percent, down from 5.9 percent
11. Oklahoma, 5.4 percent, down from 5.6 percent
12. North Dakota, 5.5 percent, up from 5.4 percent
13. Florida, 5.6 percent, down from 6.8 percent
14. Tennessee, 5.7 percent, up from 5.4 percent
15. Idaho, 6.1 percent, down from 6.8 percent
Source: U.S. Bureau of Labor Statistics
