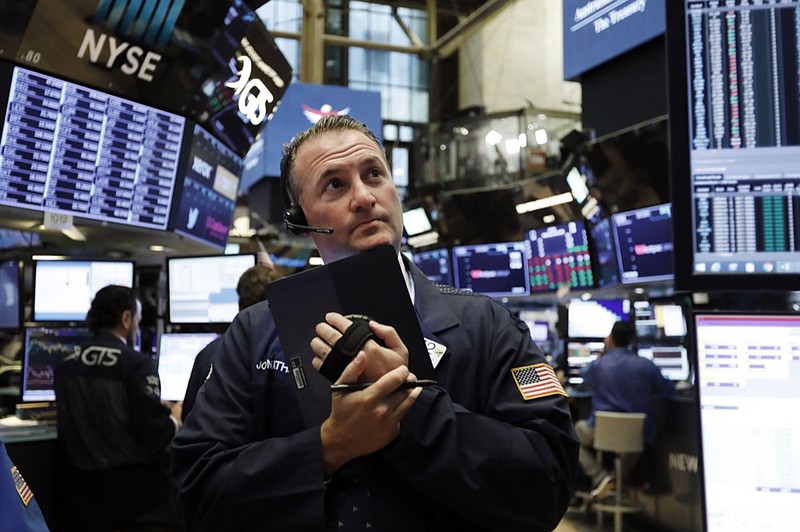
An interesting dichotomy has developed between the stock and bond markets over the past few weeks. Stock prices in the United States have reclaimed all-time highs, suggesting confidence in continued economic growth and corporate profits. Meanwhile, bond investors are singing from a different sheet of music, as their trading activity belies a high probability of impending recession. These conflicting signals present a dilemma for investors seeking to rebalance portfolios going forward. Over time, the bond market is usually right, but not always. So, let's take a look at why bonds are sounding the tocsin.
One significant predictor of future recession prospects is the behavior of longer-term interest rates compared with short-term yields. The graphical relationship is known as the "yield curve," a plot of effective rates for U.S. Treasury bonds of various maturities. Normally, investors would demand a higher interest rate for later-dated bonds since their money will be tied up longer. The benchmark indicator of the yield curve is the difference between the 10-year Treasury bond and the three-month T-bill. For example, in January 2017, the difference or "spread" between 10-year and 3-month instruments was a full two percentage points, represented by an upward-sloping (normal) yield curve.
However, from time to time the normal relationship breaks down and the yield curve "inverts" or slopes downward. This means that the effective return on 10-year bonds is actually lower than the three-month bill, a reasonably powerful predictor of economic slowdown or recession sometime over the following 12 to 18 months. It is not infallible: the yield curve has inverted several times in the post-war period without a recession following, but virtually every recession has been preceded by an inversion (think 2001 and 2007). Research from the New York Fed indicates at least a 30% probability of recession in 2020 at the current spread.
The reason longer-term rates can slip below short-term rates is simple: bond investors have grown pessimistic regarding future growth compared with the present. Considering that the current expansion is now 10 years old, such an expectation is hardly incomprehensible.
Investors (and most financial pundits) habitually overstate the importance of Federal Reserve policy over the intermediate term. For example, following its extraordinary policy responses to the Great Recession, the Fed has sought to normalize the benchmark interest rate under its control, called the Fed Funds rate, at which banks lend excess cash reserves to each other. Since December 2015, the Fed has hiked the Fed Funds rate 10 different times totaling 2 percentage points (250 basis points). However, the yield on the 10-year Treasury bond has actually declined since then from 2.2% to a recent low below the 2% threshold. This is a reminder that ultimately, the market calls the tune and often provides a powerful signal of future activity.
These developments are particularly significant, given the already-low absolute level of interest rates that leave policymakers very little ammunition with which to combat a slowdown. And the dilemma is even greater abroad: not only has the yield curve in Europe frequently inverted, but investors in the Eurozone are actually willing to accept negative interest rates on government bonds. Let that sink in: buy a $1,000 German government security, and get back $950 in fiveyears. It is estimated that over $13 trillion in negative-yielding bonds are currently outstanding, hardly a sign of optimism.
An inverted yield curve should not be taken in isolation, but on top of a destructive trade policy, increasing global tensions, and lofty stock valuations, investors would be well-served by reviewing their asset allocations to prepare for any rough weather ahead.
Christopher A. Hopkins, CFA, is a vice president and portfolio manager for Barnett & Co. in Chattanooga

