

Friday, October 30, 2026Oct 30

This story is free to read.

Interactive map shows Chattanooga area highway crashes

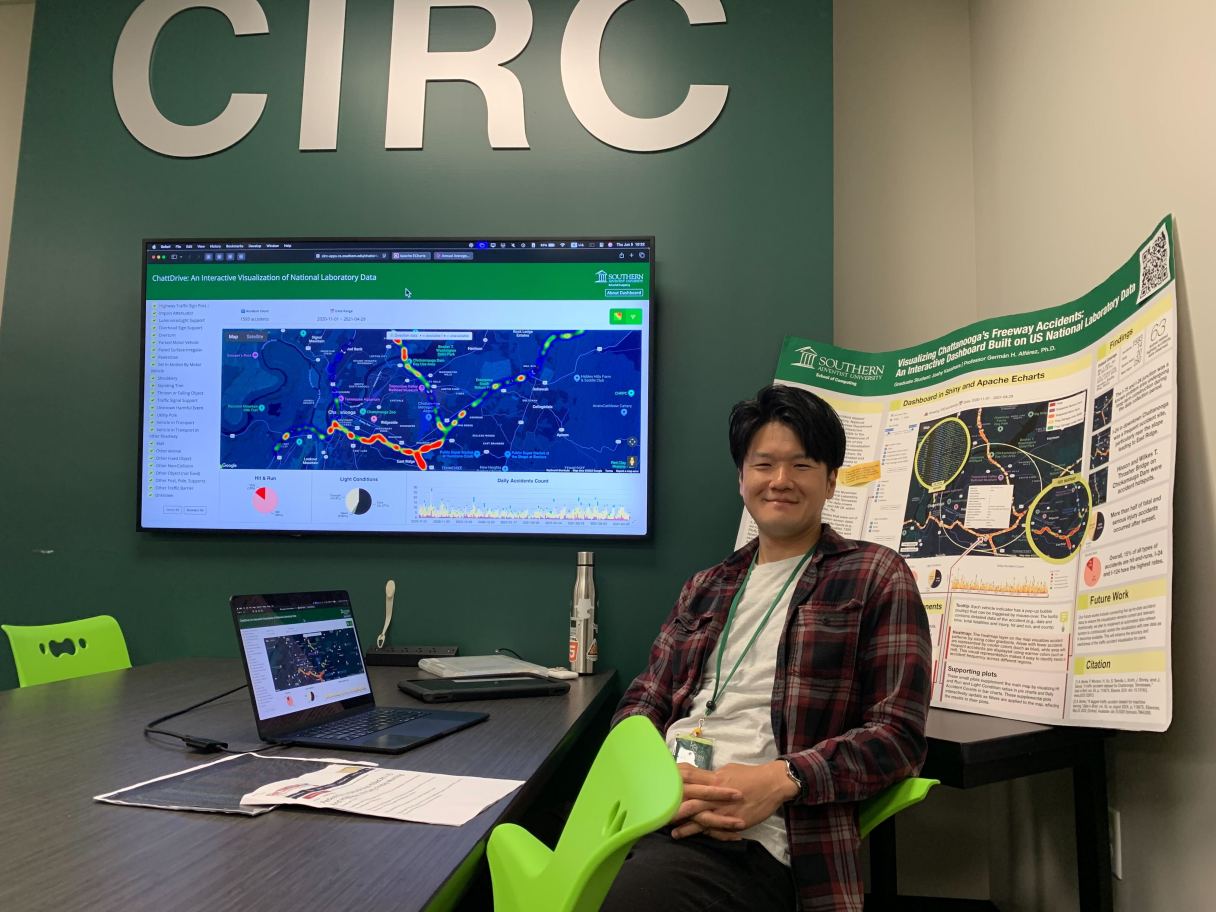
Staff photo by Ellen Gerst / On June 5, 2025, Southern Adventist University graduate student Joshy Kasahara presents his data visualization project, a map showing where accidents happen on Chattanooga area highways, at the university's Hickman Science Center.
Staff photo by Ellen Gerst / On June 5, 2025, Southern Adventist University graduate student Joshy Kasahara presents his data visualization project, a map showing where accidents happen on Chattanooga area highways, at the university's Hickman Science Center. Staff photo by Ellen Gerst / On June 5, 2025, Southern Adventist University graduate student Joshy Kasahara presents his data visualization project, a map showing where accidents happen on Chattanooga area highways, at the university's Hickman Science Center.

In Tokyo, Joshy Kasahara didn’t have to drive a car.

When he came to Collegedale to attend Southern Adventist University, Kasahara had to adjust to the highway traffic in the Chattanooga area.

“It should be easy to drive,” the graduate student said in an interview. “The space is so limited in Tokyo. We don’t have many lanes. The speed is a lot slower.”

When it came time to do a project with real-world applications for a data visualization course, Kasahara chose to tackle local traffic.

The interactive map Kasahara created puts historical data about crashes on area highways into an interactive interface. Users can zoom in on their local on-ramp or see where they’re most prone to wreck, or use the heat map feature to see general trends.