Why does Hamilton County's COVID-19 death rate appear higher than other metro Tennessee counties? The answer to that question requires some math, and experts say much of it has to do with testing practices.
Until recently, local testing for COVID-19 was only available for the sickest patients, not the ones with mild or moderate illness - the majority of people who have the coronavirus.
Dr. Jay Sizemore, medical director of infection prevention at Erlanger Medical Center and a member of the local COVID-19 task force, said only testing seriously ill patients has skewed local data, making the death rate look worse than reality.
"I suspect there's a fair number of asymptomatic individuals or mildly symptomatic individuals that over the course of time haven't been counted," Sizemore said.
Because the most commonly available county numbers for COVID-19 are the number of cases, and the number of deaths, people may make a leap to thinking the number of deaths per case is the "mortality rate." For Hamilton County, that would be 13 deaths per 141 cases as of Sunday, or 9.2%, compared to 1% in Davidson County - which has 23 reported deaths out of 2,236 cases - and 1.9% in Shelby County - which has 44 deaths out of 2,296 cases - based on data from the Tennessee Department of Health.
But that's not a true mortality rate.
In epidemiology, to calculate a county's death rate for a disease, the number of deaths recorded - the numerator - is divided by the number of people in the population - the denominator - and then multiplied by 100,000 to make the rate comparable with other counties.
Rates put health data in the perspective of the size of the population, so they can be used to compare disease frequency in different locations, at different times or among different groups.
Based on data through April 26, expressed as a rate per 100,000, Hamilton County has the second highest COVID-19 death rate (3.5 people per 100,000) among the four major Tennessee metros. The highest is in Shelby County (4.7), Davidson County is third (3.3) and Knox County is fourth (0.9). The state rate is 2.7 COVID-19 deaths per 100,000 people.
COVID-19 Death Rates
Hamilton County: COVID-19 deaths 13/368,000 residents X 100,000 = 3.5Shelby County: COVID-19 deaths 44/937,000 resident X 100,000 = 4.7Davidson County: COVID-19 deaths 23/694,000 residents X 100,000 = 3.3Knox County: COVID-19 deaths 4/470,000 residents X 100,000 = .9Sumner County: COVID-19 deaths 34/191,000 residents X 100,000 = 17.8State of Tennessee: COVID-19 deaths 181/6.8 million residents X 100,000 = 2.7Note: Death rates are per 100,000 peopleSource: Tennessee Department of Health April 26, 2020, COVID-19 report
By comparison, Sumner County, which was hit hard by an outbreak of COVID-19 in a nursing home, has a death rate of 17.8 per 100,000 residents.
Hamilton County has performed fewer tests, mostly because the COVID-19 outbreak has been less severe here than in other areas of the state, and supplies were diverted to areas of greater need. Therefore, Sizemore said, the "denominator" in the calculation of deaths per COVID-19 case is lower, which makes Hamilton County's rate of deaths per case higher.
"I think as we continue to have more available testing resources and are able to expand testing within the community, both of symptomatic individuals as well as hopefully with some screening of asymptomatic individuals, you'll see that denominator grow. And I suspect that you'll pick up on some of these less severe infections. And you'll see the death rate drop," he said.
Dr. Tim Grant, chief medical officer of Parkridge Health System, echoed Sizemore's analysis.
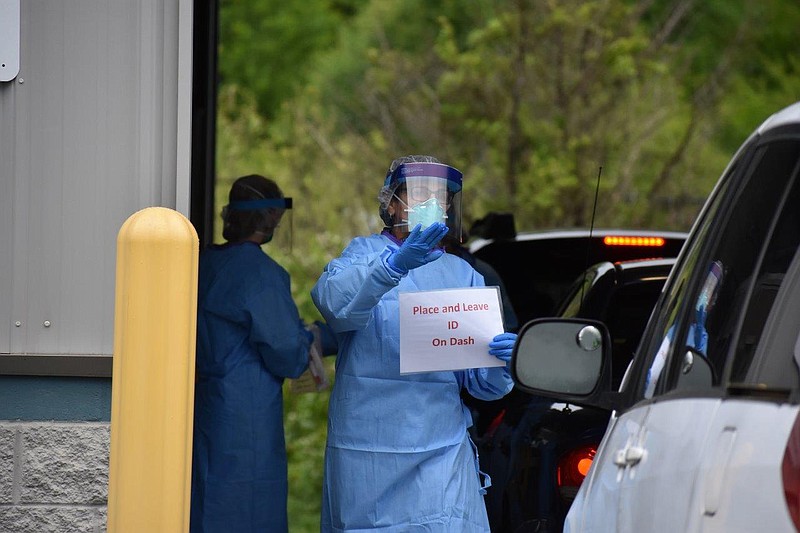
"You've seen the long lines of drive-thru testing some other communities have had, and that just simply increases that denominator such that the rate would drop," Grant said. "I completely agree it's a denominator issue."
In limited data sets, small changes to the equation - such as one or two deaths - can drastically alter the outcome.
Hamilton County Health Department officials said in an email that a major limitation in being able to draw conclusions from local COVID-19 data as compared to the other metros is the low number in statistical terms.
"While we believe that every death is a significant loss to those families and our county, it is difficult to draw any statistical conclusions based on a sample of 13," officials said.
Because serious COVID-19 complications and death are common in older people, and Hamilton County has focused on testing the sickest people, most of the county's reported cases - and deaths - are people over the age of 60.
Obtaining accurate health data is always a challenge for epidemiologists, and even more so in a fast-moving, ever-changing pandemic. Even with better disease surveillance and data, people will need to look at factors beyond the death rate to assess their risk of dying from COVID-19.
These calculations rely on the number of confirmed cases, and many people who have COVID-19 will never be tested. They also rely on the total number of deaths, which is an ever-changing figure, and some people who die will also not be tested.
Dr. Matthew Kodsi, vice president of medical affairs at CHI Memorial, said there are many factors in looking at the mortality of the coronavirus, such as the health of a population.
In the Southeast U.S., which has higher rates of chronic disease, poverty and poor health - nearly every disease is more deadly.
"It's very difficult to compare one region specifically to another without looking at the specifics of each individual case," Kodsi said.
Contact Elizabeth Fite at efite@timesfreepress.com or 423-757-6673.