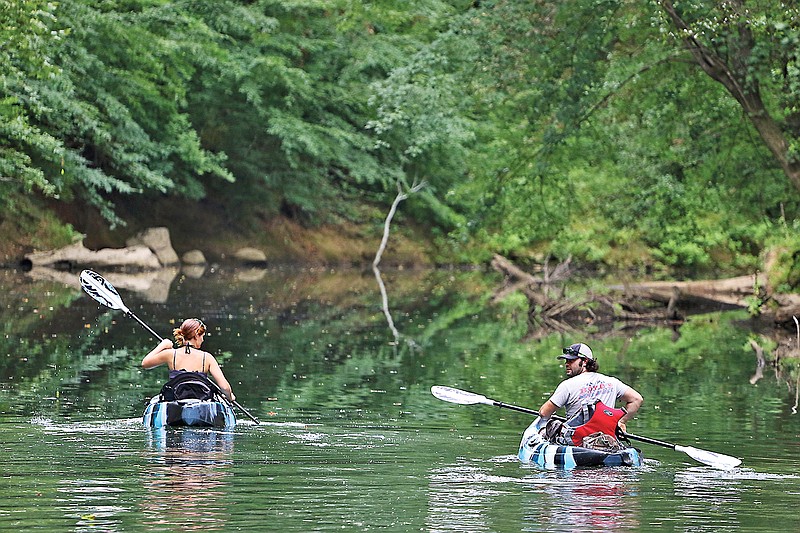
Scientists have long known the streams, rivers and lakes of the Southeast to be teeming with aquatic biodiversity.
Now, thanks in part to a local organization, freshwater biologists have a set of detailed maps showing where that diversity is strongest and where it is most endangered.
Biologists from the Tennessee Aquarium Conservation Institute in Chattanooga and the University of Georgia's River Basin Center worked on the project with grant funding from the National Fish and Wildlife Foundation.
The findings were recently published in an 86-page report expected to guide conservationists' choices about which places and species to prioritize in their ongoing efforts to protect the region's rich watersheds. It could also help with the acquisition of future grants and funding.
But Anna George, the Tennessee Aquarium's vice president for conservation science and education, hopes the visual illustration of the area's biodiversity resonates with the public, too.
"Freshwater doesn't have large, charismatic animals," George said. "There aren't whales and dolphins, but what we do have is like a rainforest, where all these different species add up together for something beautiful and unique. It's a point of pride, and what this work does is make it a little more easily understandable to people that aren't scientists that we have this incredible biodiversity in the south."
Nearly two-thirds of the country's fish species are found in the Southeast. So are almost half of the world's crayfish species and 90 percent of the nation's mussel species.
The project relied on the Conservation Institute's regional connections to gather data from museums, researchers, government reports and other agencies across 290 watersheds to be used in formulating the maps.
The maps are color-coded to illustrate priority areas for biologists based on three factors: richness, endemism and imperilment.
Richness is the total number of species in a particular watershed. Endemism is how distinctive the species are to their specific watershed. Imperilment is how endangered the species is.
An "overall priority" map included in the study combines the three factors to produce, and it shows 12-15 watersheds rising above the rest in significance, according to Duncan Elkins, a postdoctoral associate at UGA's River Basin Center.
"That doesn't mean the rest of the Southeast isn't important," Elkins said. "We know that, from a global perspective for temperate animals, the southeast is the most interesting and diverse area. But even within the southeast there is a dozen watersheds or so that sort of rose to the top as being obvious priority areas.
"That's reassuring because it means we can confidently say that there are specific areas where we should be working."
Contact staff writer David Cobb at dcobb@timesfreepress.com or 423-757-6249.