The Tennessee Valley saw more rain in 2020 than any time in recorded weather history going back well over a century despite following two consecutive record-setting wettest years in a row, according to the Tennessee Valley Authority.
Last year "was the wettest year on record in the Tennessee Valley and that covers 131 years of records," TVA River Forecast Center operations support manager Darrell Guinn said Friday as the federal agency responded to heavy rains expected to total several inches in the region over the weekend.
WRCB-TV 3 meteorologist Brittany Beggs said in her Friday weather blog that Sunday would be dry but humidity will increase as a cold front approaches later on Monday when showers and possible thunderstorms could bring another round of heavy rain and accumulations of up to 3 inches.
The next few days will be a soaker, but not quite the deluges 2020 brought, he said.
"We ended up with 70.36 inches of rainfall [in 2020] in the Tennessee Valley. That ranks highest. In comparison, the last three years had been the wettest years on record," Guinn said.
The Tennessee Valley consists of the 40,000-square-mile Tennessee River Basin and its tributaries flowing from parts of southwestern Virginia, East Tennessee, North Georgia, North Carolina, North Alabama, West Tennessee, a small portion of Mississippi and southwestern Kentucky, according to TVA spokesperson Travis Brickey.
The Tennessee Valley had above normal rainfall for 13 consecutive months, September 2019 to October 2020, Guinn said.
"Our average rainfall, to put that in perspective, is close to 51 inches," he said, "so 2020 was about 19 inches above normal."
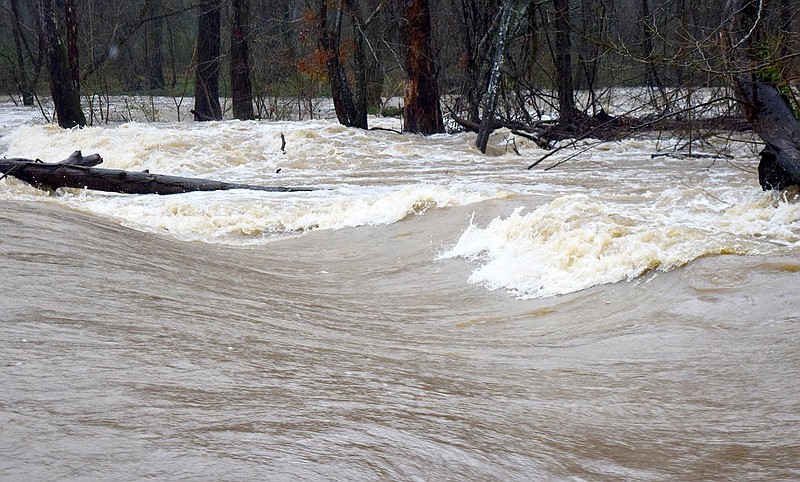
That means TVA's dams spilled a lot of water in 2020, something familiar to anyone living in the Chattanooga area over the last few years or dropping by the Chickamauga Dam in the last couple of days.
CHATTANOOGA WEATHER RECORDS
National Weather Service climatological data lists Chattanooga area weather extremes recorded since 1879.Highest temperature/107F/July 1, 2012, and June 30, 2012Lowest temperature/-10F/Jan. 21, 1985, Jan. 31, 1966, and Feb. 13, 1899Highest rainfall total in one day/9.49 inches/Sept. 5, 2011Highest rainfall total in one month/20 inches/March 31, 1993Highest rainfall total in one year/73.70 inches/1994Most snow in one day/18.5 inches/March 13, 1993Most snow in one month/20 inches/March 31, 1993Most snow in one season (Dec.-Feb.)/22.2 inches/1917-1918Most snow in one year/22.7/1992-1993Source: National Weather Service Chattanooga Climate Page
SECOND HIGHEST
Total rainfall in Chattanooga in 2020, meanwhile, stood at 72.67 inches, the second-highest mark since 1994 when 73.7 inches of rain fell in the city, according to National Weather Service meteorologist Rick Garuckas. Normal rainfall in a year for Chattanooga is 42.48 inches, records show.
"Rainfall has been the biggest story by far over the last few years," Garuckas said Friday. "In 2020, Chattanooga saw total precipitation of 72.67 inches, in 2019, they saw 63.16 inches, and in 2018, they saw 65.93 inches."
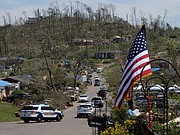
The weather news-maker in Chattanooga in 2020 was the tornado outbreak of April 12-13 that left at least a dozen dead across the tri-state Chattanooga region as seven funnel clouds carved a path of widespread destruction in Southeast Tennessee and Northwest Georgia, as well as numerous other communities across the South. The almost 7 inches of rain that fell in April went almost unnoticed except by homeowners who saw floodwaters closing in.
"The tornadoes we had around Easter were a part of the very similar type weather pattern that caused us to have such a wet year," Garuckas said. "We had warm, humid air for a couple of days with a strong cold front coming in from the west."
That's the typical recipe for "widespread organized thunderstorms, some of which can be severe," he said.
"On that particular day, besides the cold front approaching and interacting with the warm, moist environment, we had strong wind sheer aloft in the atmosphere," he said. "That created an environment in far Southeast Tennessee near Chattanooga where the tornado potential was really high."
Tennessee's Severe Weather Awareness Week for 2021 starts Sunday and ends March 6, so the weather service in Morristown is presenting a new weather topic each day on the weather service's Facebook and Twitter pages, Garuckas said. Tennessee's severe weather season peaks in April, he said.
People can also learn from the past.
One lesson learned from last April's tornadoes was the need for people to have multiple, reliable sources of weather information, he said. The traditional standby, a weather radio, will sound an alarm for alerts that can be tailored to a specific county. Officials also urge people to follow the weather service on its Facebook and Twitter pages for the latest word when storms threaten.
"And a smartphone with wireless emergency weather alerts set to 'on' is a really good way to receive warnings, too," he said.
TENNESSEE VALLEY RAIN TOTALS
2020: 70.36 inches2019: 66.47 inches2018: 67.02 inches2017: 55.61 inches2016: 43.23 inches2015: 58.78 inches2014: 52.8 inches2013: 63.88 inchesSource: Tennessee Valley Authority, River Forecast Center
TVA DAMS
"Everybody talks about the weather, but nobody does anything about it," the saying goes, but TVA officials said the agency's dams do save lives and property by controlling the amount of water headed downstream that the weather leaves behind.
TVA's network of 49 dams on the Tennessee River and its tributaries help control the flow of the fifth largest river in the United States and stem flood damage that would otherwise occur without them. Heavy rains in 1917, 1867 and 1891 left much of Chattanooga underwater.
"In 2020, we averted close to $800 million in [damage in] Chattanooga, and throughout the valley that number creeps up closer to $1 billion," Guinn said.
The Chattanooga area has the greatest flooding threat, he said.
Chattanooga is the drainage basin for East Tennessee, parts of western Virginia, North Carolina and Northeast Georgia and is the area most susceptible to flooding because of the bottleneck created by the geography of the Tennessee River Gorge in Hamilton and Marion counties, Guinn said.
"Chattanooga usually accounts for 90% of the flood damages we avert every year," he said.
On the other hand, there is a benefit for hydro-electric power generation when there's abundant rain.
Wet years "definitely contribute to keeping the rates low," he said. "Last year in 2020 we were about 33% above normal in generation and that was definitely a benefit to everyone in the valley."
LONG RANGE LOOK
"It's always the crystal ball question of what's the rest of the year going to look like," Guinn said. TVA depends on the National Weather Service's Climate Prediction Center in planning ahead for the Tennessee Valley.
However, early weather data for 2021 only gives equal changes of above or below average rain for the first three months of the year, Guinn said, "and that doesn't really tell us anything."
"February up until today has been near normal and that's likely to change over the weekend," Guinn said Friday. "This is the time of year that we typically have seen heavy rainfall events, and that's why we have reservoirs drawn down to winter pool levels so that we can respond to these weather events."
Garuckas said the weather service is watching developments in the Pacific Ocean.
"We're coming out of a La Niña pattern, which is [related to] cooler than normal waters in parts of the Pacific Ocean, and it looks like that pattern is going to continue to weaken as we go through spring and into the summer," Garuckas said of what could be a developing trend.
"Historically, in some years when we had a weakening La Nina we had an above normal severe weather season," he said.
Forecasts still aren't certain but there are "pretty good chances of above normal temperatures, and that's the reason the season could be more active," he said. "But it doesn't necessarily mean it will be."
Contact Ben Benton at bbenton@timesfreepress.com or 423-757-6569. Follow him on Twitter @BenBenton or at www.facebook.com/benbenton1.